In April 2017, the Peel Social Lab surveyed approximately 568 students enrolled in our Introduction to Sociology course (SOC100H5). This survey was intended to capture the UTM student experience, and the first iteration focused on experiences with multiculturalism and disability (primarily on campus) and perceptions of resistance.
- View codebook
- Download Excel (.xlsx) data file
- Download Stata (.dta) data file
- Data Highlights
- Figures
Data Highlights
- Demographics of respondents and their caregivers
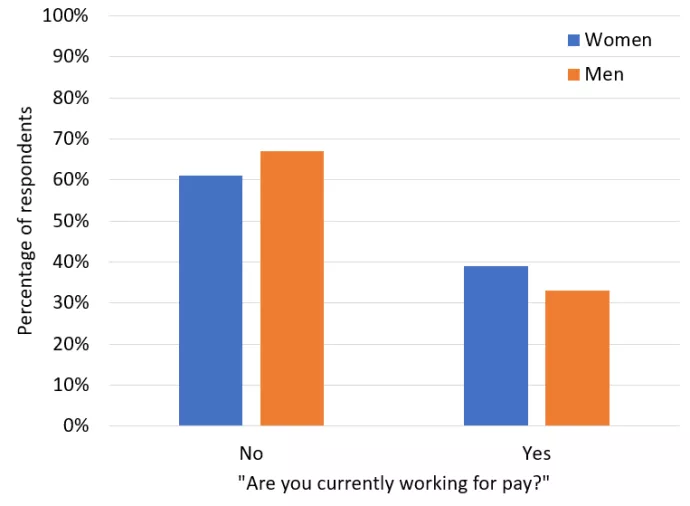
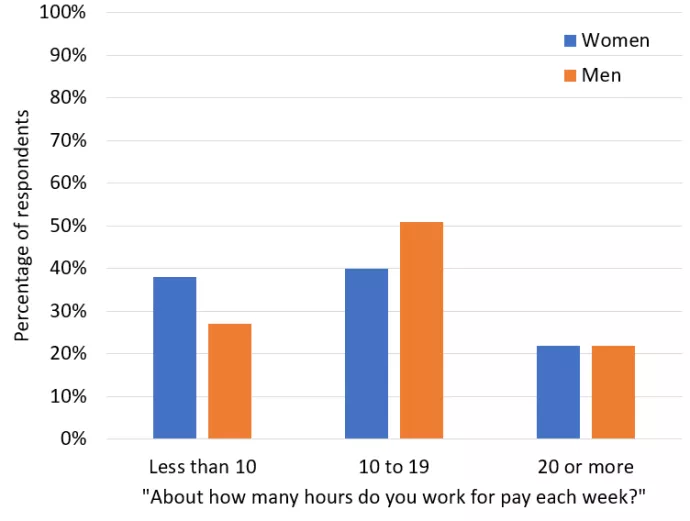
- 37% of students surveyed were currently working for pay, with 22% of working respondents working 20 or more hours a week
- Students surveyed were most likely to identify as women (65%), Canadian-born (53%), and South Asian (29%)
- 4% of respondents reported having a disability
- Most respondents lived in Mississauga (55%), and 72% of those in Mississauga lived off campus
- When asked about their caregivers, 82-84% of the first two caregivers respondents listed were foreign-born, and 41% of them had at least a Bachelors degree (or equivalent)
- Health and wellbeing
- 78% of respondents rated their health as at least “good”
- 66% rated their mental health as at least “good”
- About a third of respondents reported often feeling “helpless” dealing with life problems (30%) or “pushed around in life” (33%)
- Academic Background and Career Plans
- Respondents were most likely to report interest in working in the fields of medicine (26%), science/technology (26%), and business (22%) upon completing their education
- 22% report planning to start their own business after completing their education
- Equity and diversity
- On average, respondents reported that most faculty, staff, and administrators at UTM were “very welcoming” to visible minorities
- Students on average reported agreeing that:
- Students at UTM treat them respectfully regarding their race/ethnicity;
- Faculty are sensitive to barriers faced by students of colour;
- They would recommend UTM to students of colour as a supportive educational environment;
- The student counseling center at UTM provides services that are culturally/racially sensitive;
- They do not feel the need to minimize various aspects of their culture to “fit in” to the culture at UTM
- The majority (88-96%) of respondents have learned about the topics of slavery, residential schools, colonialism, and racism in Canada while attending educational institutions
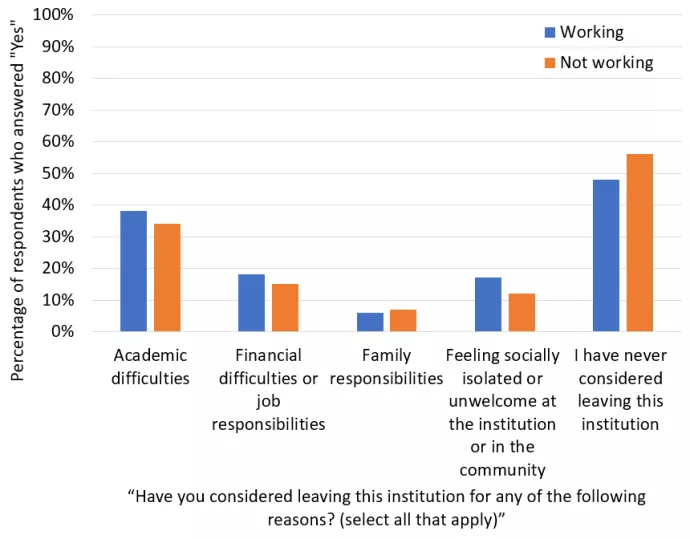
- 53% of respondents have never considered leaving UTM, however:
- 35% have considered leaving for academic difficulties;
- 16% have considered leaving for financial difficulties or job responsibilities;
- 14% have considered leaving due to feeling socially isolated or unwelcome at UTM or the broader local community
Figures
Figure 1. Percentage of women and men who are working for pay

|
|
No (%) |
Yes (%) |
|---|---|---|
|
Women |
61 |
39 |
|
Men |
67 |
33 |
Figure 1 is a clustered column chart. It presents responses to the question “Are you currently working for pay?”, as noted in the title of the horizontal axis. The horizonal axis presents two answers: 1) No; 2) Yes. The vertical axis shows percentages from 0% to 100%. The legend shows that the results are divided into two categories: 1) women (blue columns); 2) men (orange). The columns represent the percentage of respondents in each category who selected one of those two answers. The table below the chart presents the same information.
Figure 2. Paid weekly hours worked among men and women who worked

|
|
Less than 10 (%) |
10 to 19 (%) |
20 or more (%) |
|---|---|---|---|
|
Women |
38 |
40 |
22 |
|
Men |
27 |
51 |
22 |
Figure 2 is a clustered column chart. It presents responses to the question “About how many hours do you work for pay each week?”, as noted in the title of the horizontal axis. This question was asked only to respondents who indicated that they were working for pay. The horizonal axis presents three answers: 1) less than 10 hours, 2) 10 to 19 hours, and 3) 20 or more hours. The vertical axis shows percentages from 0% to 100%. The legend shows that the results are divided into two categories: 1) women (blue columns); 2) men (orange). The columns represent the percentage of respondents in each category who selected one of those three answers. The table below the chart presents the same information.
Figure 3. Percentage of working and non-working students who have considered leaving UTM for certain reasons, or not at all

|
|
Academic difficulties (%) |
Financial difficulties or job responsibilities (%) |
Family responsibilities (%) |
Feeling socially isolated or unwelcome at the institution or in the community (%) |
I have never considered leaving this institution (%) |
|---|---|---|---|---|---|
|
Working |
38 |
18 |
6 |
17 |
48 |
|
Not working |
34 |
15 |
7 |
12 |
56 |
Figure 3 is a clustered column chart. It presents responses to the question “Have you considered leaving this institution for any of the following reasons?”, as noted in the title of the horizontal axis. Respondents could select multiple answers. The horizonal axis presents five answers: 1) academic difficulties; 2) financial difficulties or job responsibilities; 3) family responsibilities; 4) feeling socially isolated or unwelcome at the institution or in the community; 5) “I have never considered leaving this institution”. The vertical axis shows percentages from 0% to 100%. The legend shows that the results are divided into two categories: 1) those who are working (blue columns); 2) those who are not working (orange). The columns represent the percentage of respondents in each category who responded “Yes” to any of those answers. Therefore, the five sets of columns represent five different variables, and totaling the different answers may not add up to 100%. The table below the chart presents the same information.
